
A report from SolarPower Europe earlier this year found that the use of solar PV in Europe was saving EU countries over €110 million (US$127.5 million) a day by eliminating the need to import oil from the Middle East during the recent conflict. SolarPower Europe’s latest report notes that the electricity generation of solar power in 2025 was equivalent to 540bcm of natural gas, or five years’ worth of gas shipments through the Strait of Hormuz, the closure of which has significantly disrupted the global energy system.
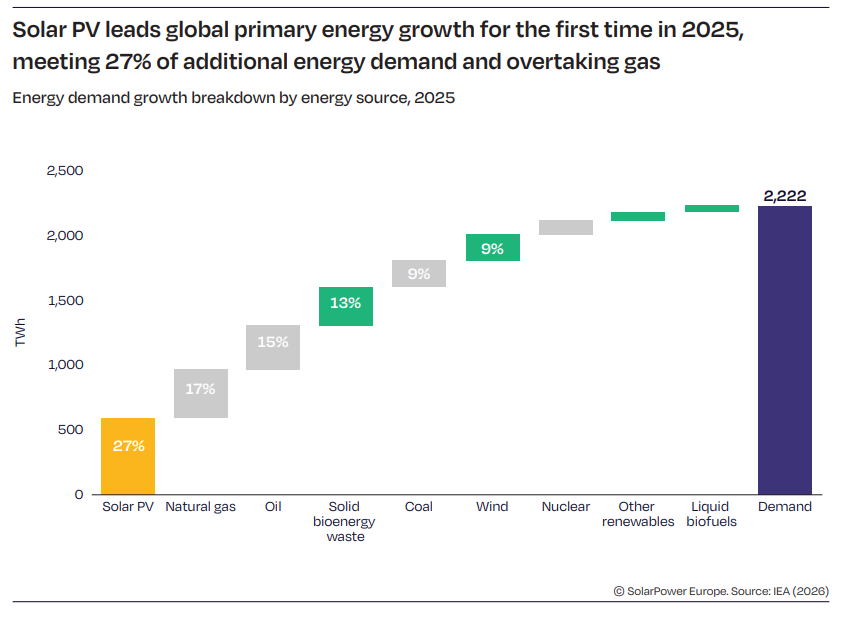
Perhaps most impressively, solar PV led primary energy growth in 2025, exceeding gas for the first time. As shown in the graph above, solar PV met 27% of additional energy demand, ahead of all other renewable energy sources—bioenergy was second with 13%—and non-renewable energy sources—gas was second with 17%.
“The solar age is firmly established,” said SolarPower Europe CEO Walburga Hemetsberger. “With another record year in capacity additions in 2025, solar continues to outperform all other energy technologies.”
China remains ‘by far’ the world’s leading solar market
The report also noted that China remains “by far” the world’s leading solar market, adding 382GW of new capacity in 2025, around 100GW more than all other markets combined.
This sustained growth has come as other markets have experienced stagnant growth, or even declines, in new capacity additions. The US, which ranks second for cumulative operational capacity, saw new capacity additions decline by 14% between 2024 and 2025; the SolarPower Europe report described the US solar sector as one of “adjustment”, where US developers have had to adapt to an increasing hostile policy landscape under the Trump administration, compared to the Biden-era Inflation Reduction Act (IRA) incentives.
Meanwhile Germany, Europe’s largest solar market, saw capacity additions remain unchanged between 2024 and 2025, while Brazil, the world’s sixth-largest market, saw a 23% year-on-year decline in new capacity additions. As a result, China’s contribution to new capacity additions has ticked upwards, from China being responsible for 55% of new capacity additions in 2024 to 57% of new capacity additions in 2025.
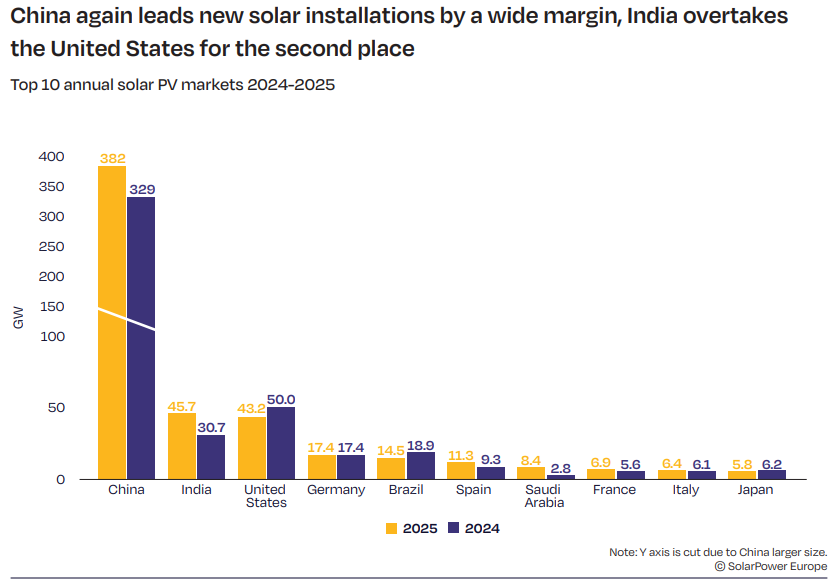
These trends are shown in the graph above. The report goes on to emphasise China’s dominance of capacity deployments in the global solar sector; for instance, China added 336GW more than the second-largest market, India, in 2025. China is also eight times larger than the second-largest market, nine-times larger than the third and has 26 times as much solar capacity deployed as the fifth.
SolarPower Europe points out that solar deployments are relatively highly concentrated in a number of countries beyond just China—the top ten markets accounted for 82% of global installations in 2025—but the fact that China accounted for over half of global capacity additions last year shows China’s dominance in solar deployment.
Capacity additions to decline in 2026
It is for this reason that changes in China can have a significant impact on the global solar sector. Indeed, SolarPower Europe expects 2026 to see fewer capacity additions than in 2025, with its medium scenario anticipating an 8% year-on-year decline and its low scenario suggesting a 25% decline in new solar deployments.
These forecasts are shown in the graph below. Much of this slowdown comes from a changing policy landscape in China. SolarPower Europe expects to see a 24% year-on-year drop in new installations in China—the first time that new capacity additions has fallen from one year to the next in over 20 years—as the China Photovoltaic Industry Association (CPIA) has sought to end the race to the bottom in solar PV module prices in China, which has contributed to large deployment figures but has made production unprofitable for many leading Chinese manufacturers.
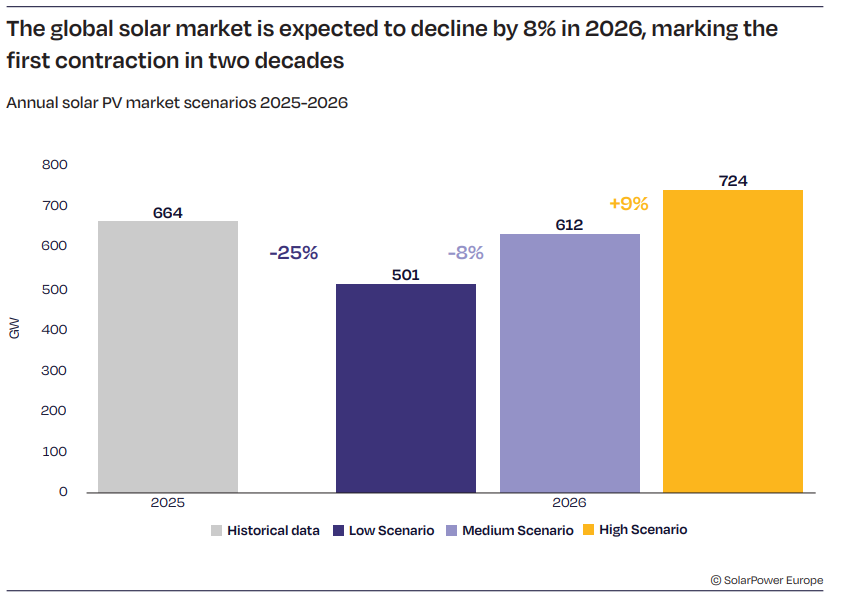
While Hemetsberger said that “the solar age is firmly established,” the trade body noted that the pace of new capacity additions is declining, ahead of its forecast for contraction in 2026. The 664GW of new capacity added in 2025 is just a 12% year-on-year increase over the capacity added in 2024; this compares to a 32% year-on-year and 85% year-on-year increase in capacity additions over the previous years.
The report adds that, while SolarPower Europe’s medium scenario expects cumulative capacity to more than double to 6.6TW by 2030, this is a downward revision from last year’s forecasts of 7.1TW, highlighting that work will need to be done to maintain, or even return to, the high levels of growth seen in previous years.
“In a growing number of markets, deployment is increasingly constrained by system integration challenges, from grid congestion to curtailment and negative price signals,” said Hemetsberger. “We urgently need to invest in grids, battery storage and other non-fossil flexibility solutions to continue integrating large volumes of renewables into our grids.”
The report makes a number of policy recommendations to tackle some of these challenges, including a call to “accelerate grid investment” and change electricity markets to “reward flexibility and self-consumption”. SolarPower Europe also puts particular emphasis on Australia in this year’s report, and points to the increasing deployment of both residential solar projects and battery energy storage systems (BESS) as an example of the co-location of the technologies that could be essential for the next phase of the energy transition.
For instance, around 69,000 BESS were coupled with solar projects in Australia in April 2026, a pace of additions that SolarPower Europe called “extraordinary” and means that Australia’s distributed storage fleet could reach the multi-gigawatt-hour scale within months.
“This acceleration was driven by the Cheaper Home Batteries Program (CHBP), broader policy momentum following Labor’s May 2025 re-election and continued declines in system costs,” reads the SolarPower Europe report, emphasising the role that supportive policy has to play in facilitating and incentivising solar-plus-storage deployments.
There is also growth in Australia outside the distributed solar sector; figures from the country’s Clean Energy Regulator (CER) show that Australia’s large-scale renewable energy pipeline has reached 32GW of capacity.
via PV Tech https://ift.tt/k5TAYSl
Categories: Energy
